


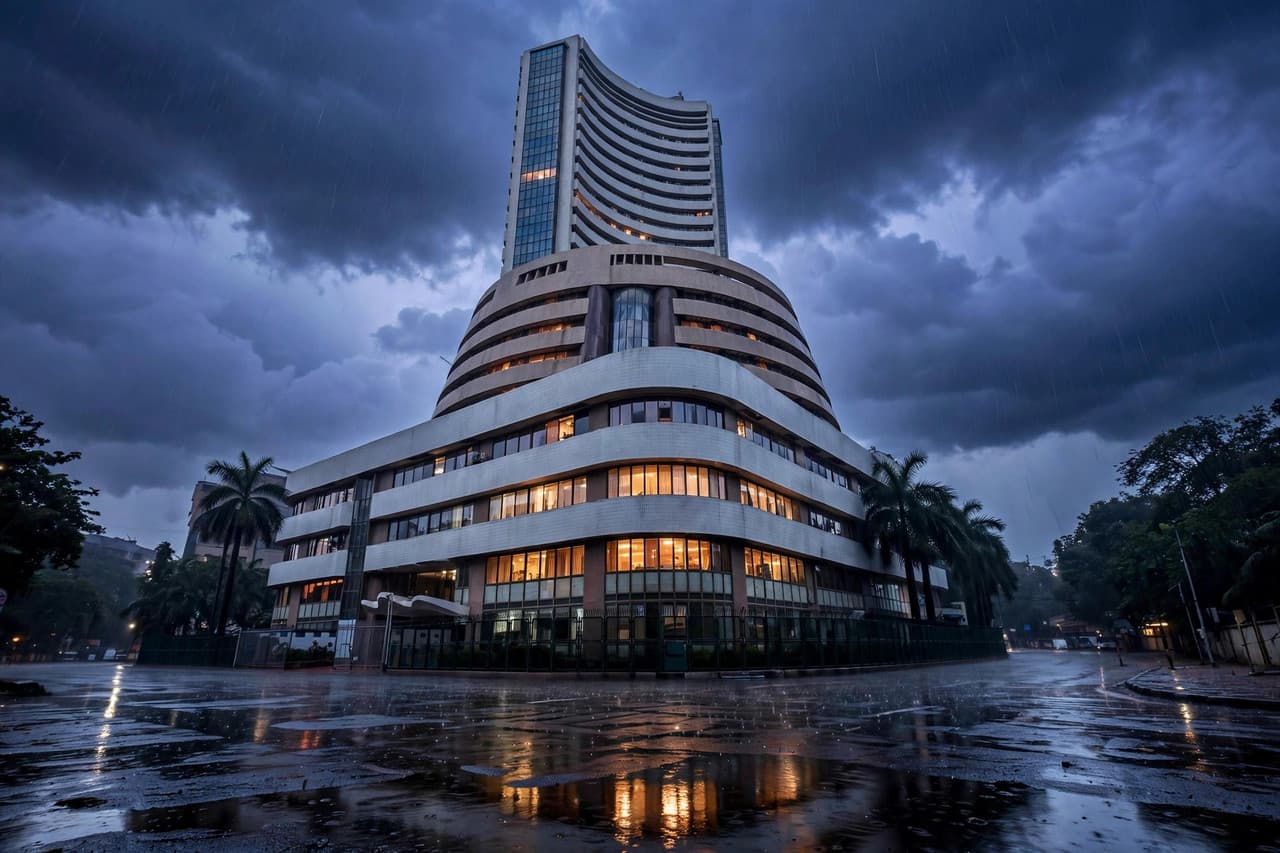
After pulling money out of Indian shares for two straight months, foreign portfolio investors (FPIs) bought a net ₹84,290 crore of Indian equities in nine trading sessions between 2 and 13 November — about ₹9,366 crore a session. It is one of the strongest foreign buying sprees in recent years, arriving while domestic institutions sold. If you run a SIP, this is the flow story behind the rally in your portfolio — and the one most likely to be misread.
Quick Answer: FPIs bought a net ₹84,290 crore of Indian shares in nine sessions (2–13 November), reversing outflows of ₹70,704 crore in September–October. It explains the Nifty's 13.1% rebound from its 8 October low — but FPIs are still net sellers of about ₹2.1 lakh crore this year, so keep your SIP on your plan, not the headlines.
The numbers, with every window labelled
Depository data, reported by PTI on 15 November 2026: FPIs made a net investment of ₹84,290 crore in Indian equities during 2–13 November, covering nine trading sessions. (The Economic Times reports ₹84,291 crore — the same number, rounded differently.) FPIs were net buyers in all four sessions of the holiday-shortened week ended 13 November. Three numbers keep the headline honest. First, the reversal: FPIs withdrew ₹35,861 crore in September and ₹34,843 crore in October — ₹70,704 crore combined — so November's buying is about 119% of the two months of selling before it. Second, the year: even after November, FPIs remain net sellers of around ₹2.1 lakh crore in Indian equities in 2026, down from nearly ₹3 lakh crore a few weeks ago — a narrowing, not a reversal of the year. We covered that outflow side in October; this inflow is the other half of the same story. Third, the other side: in the week ended 13 November, FPIs bought a net ₹33,340 crore while domestic institutions sold a net ₹24,190 crore (The Economic Times, citing Bajaj Broking), the third straight week of foreign buying after ten weeks of selling. Debt moved the same way: FPIs invested ₹7,815 crore via the Fully Accessible Route and ₹1,167 crore via the general route, and withdrew ₹702 crore via the Voluntary Retention Route.
Why they came back
The reasons are attributed, not asserted. Reporting on the depository data points to three drivers: a global sell-off in crowded artificial-intelligence stocks, rotating money towards cheaper markets; Brent crude falling about 13% in the first week of November to near $97 a barrel, easing India's import bill; and attractive valuations in large-cap Indian shares, with improving earnings visibility (PTI, quoting Trackk and MIRA Money). The market move matches the flow: the Nifty 50 closed at 22,231.80 on 8 October, its lowest close of the month, and at 25,144.30 on 13 November — a 13.1% rebound — and is up 9.1% in November alone from the 30 October close of 23,053.10. Bloomberg, via The Economic Times, adds the global frame: overseas buyers have bought a net $8.5 billion of Indian shares in November, and the MSCI India gauge is up 11% from its October six-month low, recovering more than $400 billion of market value. Moneycontrol notes buying across financials, telecom, capital goods, pharmaceuticals and automobiles, while domestic institutions used the rally to book profits.
What it does not mean
Two warning signs travel with the same story, and The Economic Times flags both: October retail inflation came in at 6.09%, above the RBI's 6% upper tolerance limit, and Brent crude has moved back above $95 a barrel after its early-November fall. Neither kills the inflow story; both explain why it may not last — flows reversed as recently as September and October. And the two tallies you may see for November are not a contradiction: the depository figure of ₹84,290 crore and the exchange-based FII figure of about ₹79,302 crore (our 14 November DII article) count different things, because depository data includes primary-market flows that exchange data does not. Compare figures only within the same source.
What it means for your SIP
Nothing about your SIP's maths changed this week — and that is the point. A ₹5,000 monthly SIP at an assumed 12% return builds about ₹11,61,695 in ten years, whether FPIs are buying or selling in any given fortnight; the return assumption, not the flow headline, decides the outcome, and even the assumption is not a promise. What the inflow changes is the mood: rising markets make pausing a SIP feel safe and topping up feel clever — both are timing in disguise. The disciplined response is boring — keep the SIP running, check once a quarter whether the amount still fits your goal, and let flow data tell you what institutions did, not what you should do next.
Loading the calculator…
Estimates from your inputs and the assumptions shown; returns are not guaranteed. Education only, not investment advice. Open the full SIP Calculator.
The myfw app · free to use
Keep these numbers.
The free myfw app saves your SIP Calculator scenarios, works offline and reminds you to stay on track.
On your phone? Open this page there to jump straight into the app.
What to watch next
Three things decide whether November stays a buying month or becomes a two-week story: the US Federal Reserve's policy signals and developments in West Asia, the next triggers per Moneycontrol; the full-month FPI total, which Bloomberg characterises as heading for the biggest monthly inflow in six years — a characterisation, not yet a fact; and whether domestic institutions keep selling into the rally, as they did with a net ₹49,089 crore in November to 13 November (our 14 November article, Alphave data). Wholesale inflation for October is due on Monday 16 November — no figure exists yet, and this article states none.
Is ₹84,290 crore a record FPI inflow?
Will the Nifty keep rising because FPIs are buying?
Should I increase my SIP because foreign investors are buying?
Why do different reports show different FPI numbers for November?
Ready to start?
Check your SIP is still running and set a reminder to review the amount against your goal — not to time the market, but to confirm it still fits. Try your own numbers in the SIP Calculator on myfinancewisdom.com. Follow @myfwindia on Instagram for the daily checklist version of this guide. Get the myfw app on Google Play — 22+ calculators in your pocket.
Learn MoreEducational content only — not financial advice. Consult a SEBI-registered investment adviser for personal guidance; investments are subject to market risk.
Sources: PTI via The Telegraph / The Federal / Business Standard / The Hindu BusinessLine, 15 November 2026 (depository data: ₹84,290 crore, 2–13 November; September–October outflows; ~₹2.1 lakh crore net sellers in 2026; debt flows). The Economic Times, 15 November 2026 (₹84,291 crore; week ended 13 November FPI +₹33,340 crore / DII −₹24,190 crore, Bajaj Broking; Bloomberg $8.5 billion / MSCI India +11% / $400 billion+ recovered; two warning signs: October CPI 6.09%, Brent above $95). Moneycontrol, 15 November 2026 (sector buying; Fed and West Asia watch). NSE closes: Nifty 22,231.80 (8 Oct), 23,053.10 (30 Oct), 25,144.30 (13 Nov). DII November total ₹49,089 crore and FII ₹79,302 crore: Alphave, via our 14 November article. SIP illustration at an assumed 12% return; returns are not guaranteed.